Getting Started with Anaphora
Welcome to Anaphora! This guide will help you install and configure Anaphora for automated Kibana and Grafana reporting.
What is Anaphora?
Anaphora is a self-hostable reporting and alerting automation system that turns authenticated dashboards and web applications into:
- Snapshots — Page or panel captures from Kibana, Grafana, or any web UI
- Reports — PDFs assembled from snapshots with text, images, and custom layouts
- Deliveries — Email, webhook, Slack, or S3 archiving
- Alerts — High-frequency jobs that notify only on relevant findings (with throttling)
The Key Principle
If a human can reach it in a browser, Anaphora can automate it.
The enabling technology is a headless Chrome-based connector that does what a human does:
- Navigate to URLs
- Authenticate (including complex SSO flows)
- Click, type, and submit forms
- Reach desired view states
- Capture snapshots deterministically
System Architecture
Anaphora processes each job run through four pipeline stages:
Core Concepts
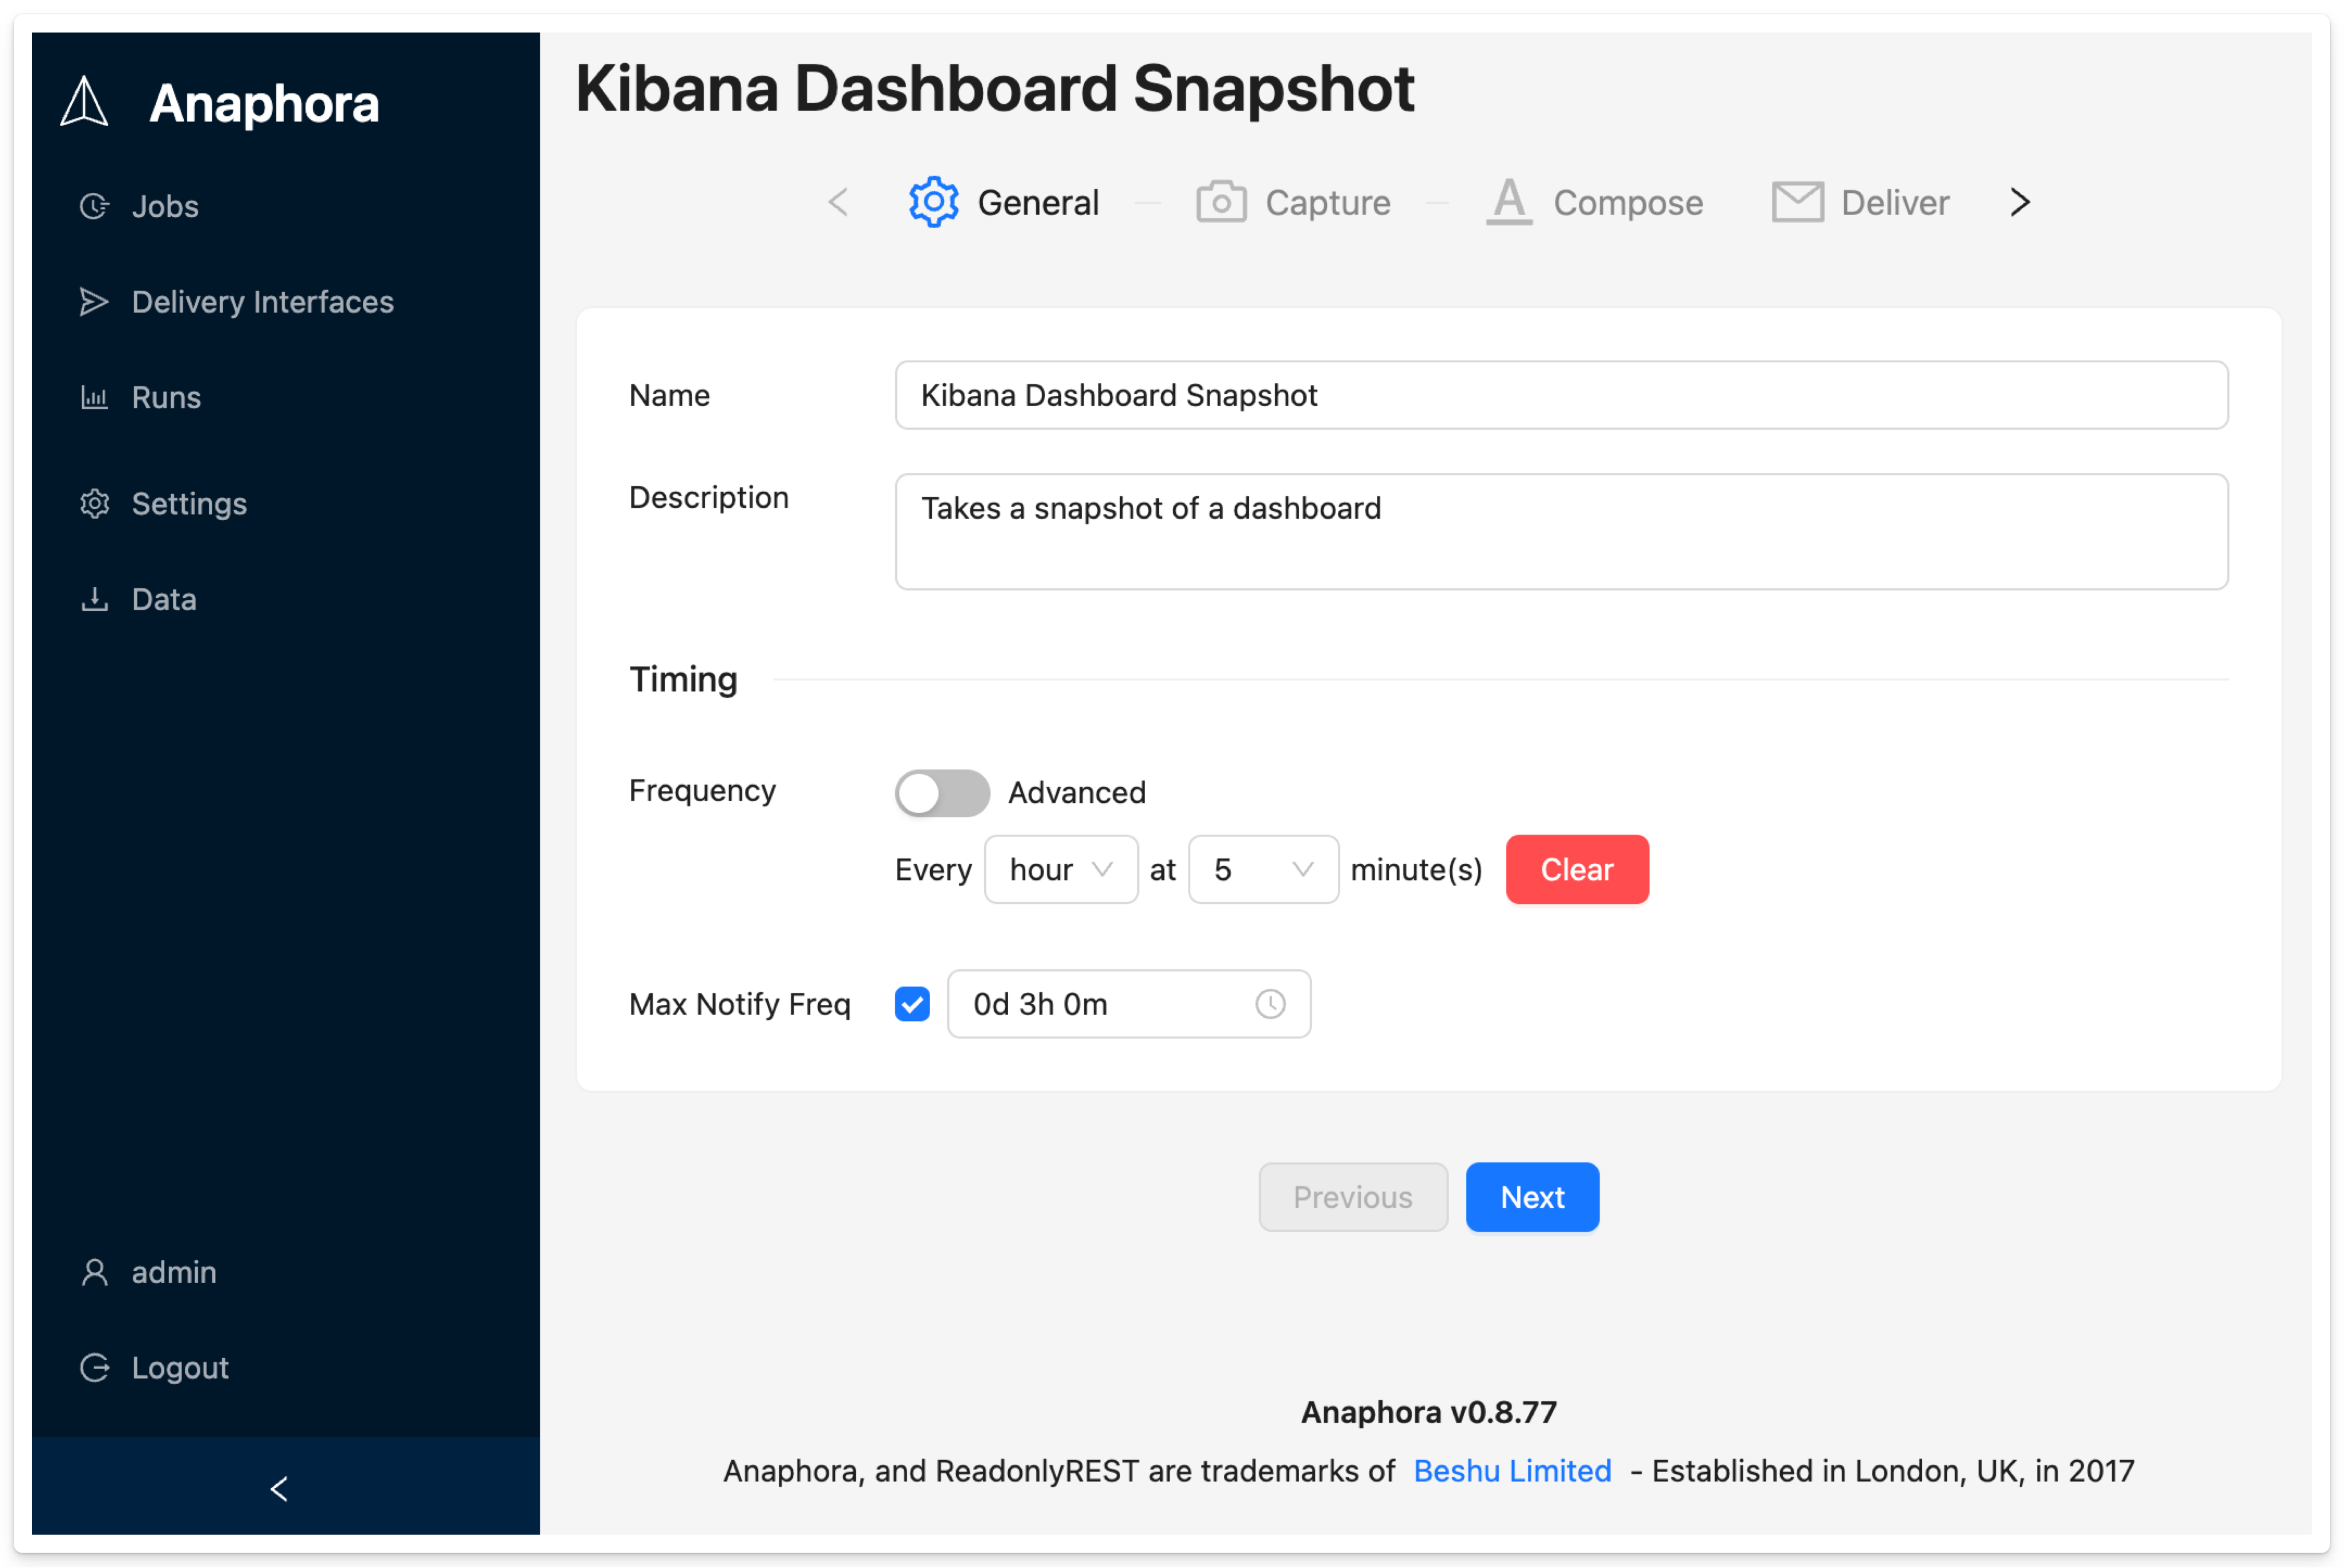
Job
The main configuration unit — a periodic execution that captures, composes, and delivers reports. Configured across four tabs: General, Capture, Composer, and Delivery.
Run
One execution of a job. Logged with timestamps, success/failure status, error details, and produced artifacts.
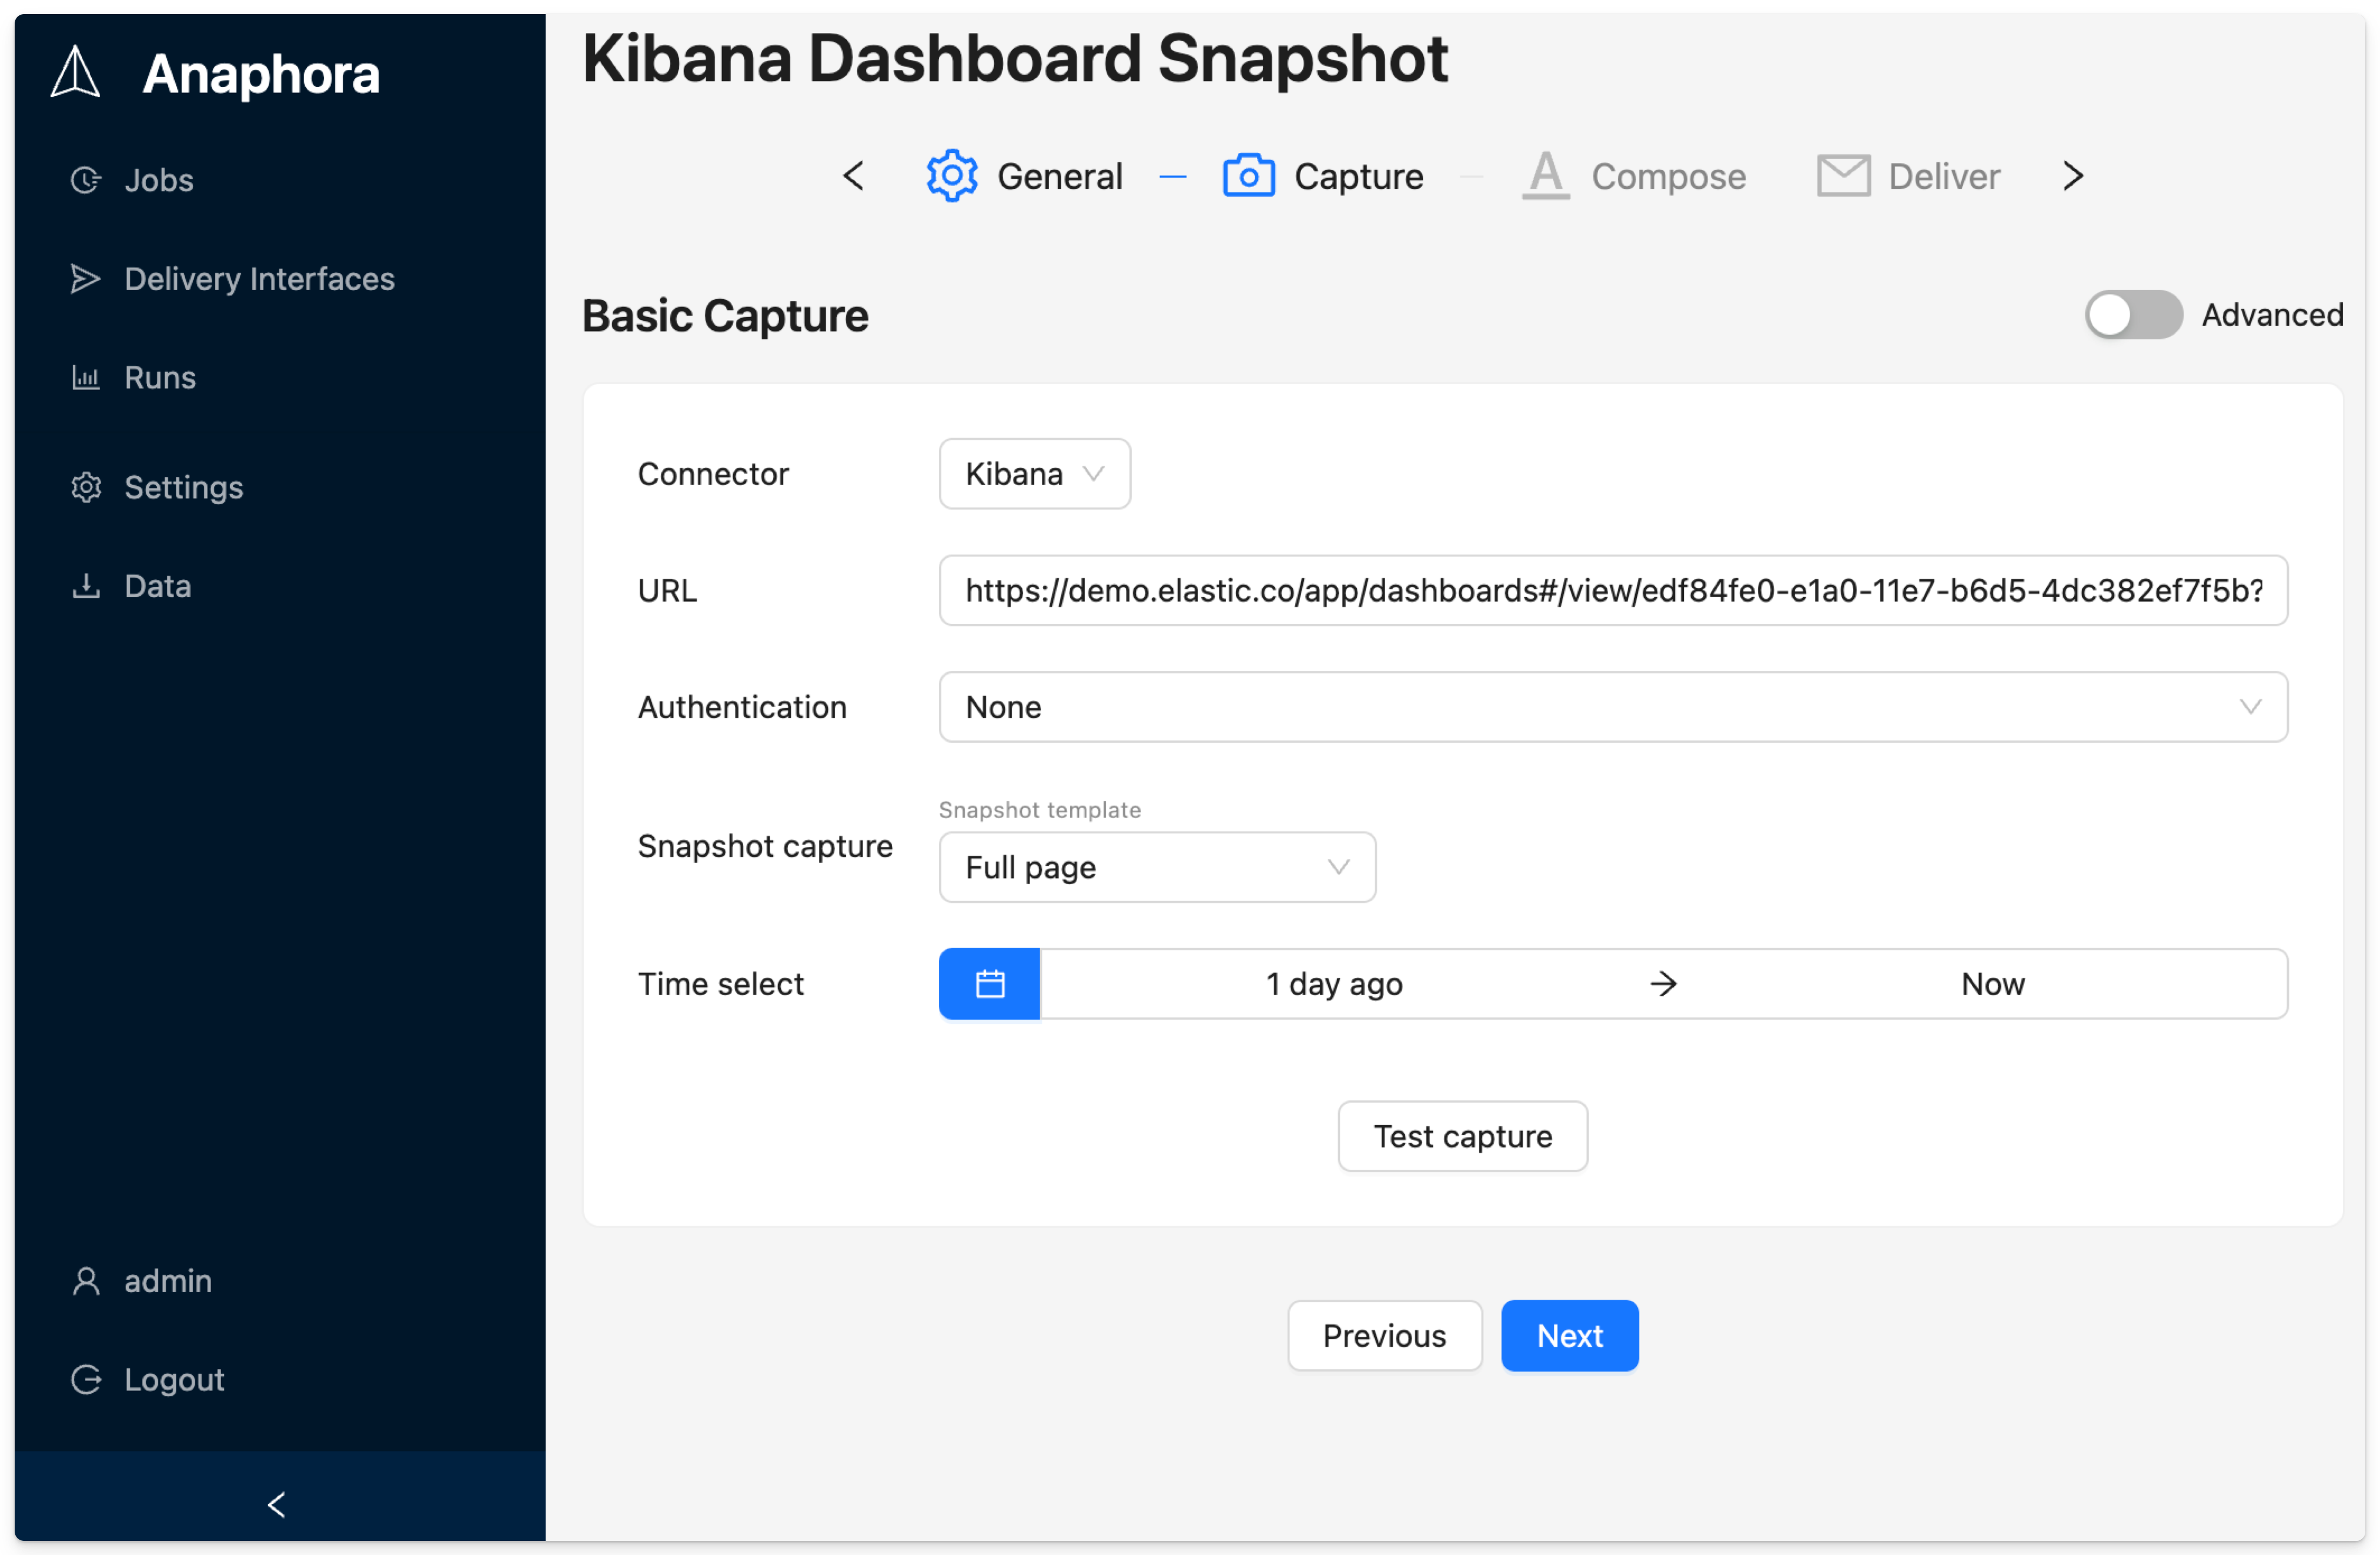
Snapshot
A captured representation of a web view — either whole page or per-visualization (for Kibana dashboards).
Report
A rendered PDF assembled from snapshots, text blocks, layout elements, and branding.
Delivery Interface
A reusable destination configuration (webhook, SMTP, Mailgun, S3) that can be shared across jobs.
Space
A "share-nothing" container that isolates jobs, delivery interfaces, AI providers, and artifacts for multi-tenant deployments.
Supported Connectors
| Connector | Status | Description |
|---|---|---|
| Kibana | Available | Dashboards, Canvas, Discover with auto-detection |
| Grafana | Available | Dashboards and panels via API |
| Generic Web | Available | Any authenticated web application |
| Metabase | Coming Soon | Metabase dashboards and questions |
Quick Start
- Install Anaphora using Docker or your preferred method
- Configure your connections and settings
- Follow the Basic Examples to create your first job
Use Cases
Scheduled Reports
- Daily Kibana dashboard snapshots for stakeholders
- Weekly metric summaries from Grafana
- Monthly trend reports combining multiple data sources
- S3 archiving for historical compliance records
Intelligent Alerts
- High-frequency jobs (every 5-10 minutes) with notification throttling
- Conditional notifications only when thresholds are exceeded
- AI-analyzed anomaly detection with contextual summaries
Multi-Source Reports
- Combine captures from multiple dashboards in one report
- Advanced capture workflows for complex navigation paths
- Multi-step browser automation for authenticated applications
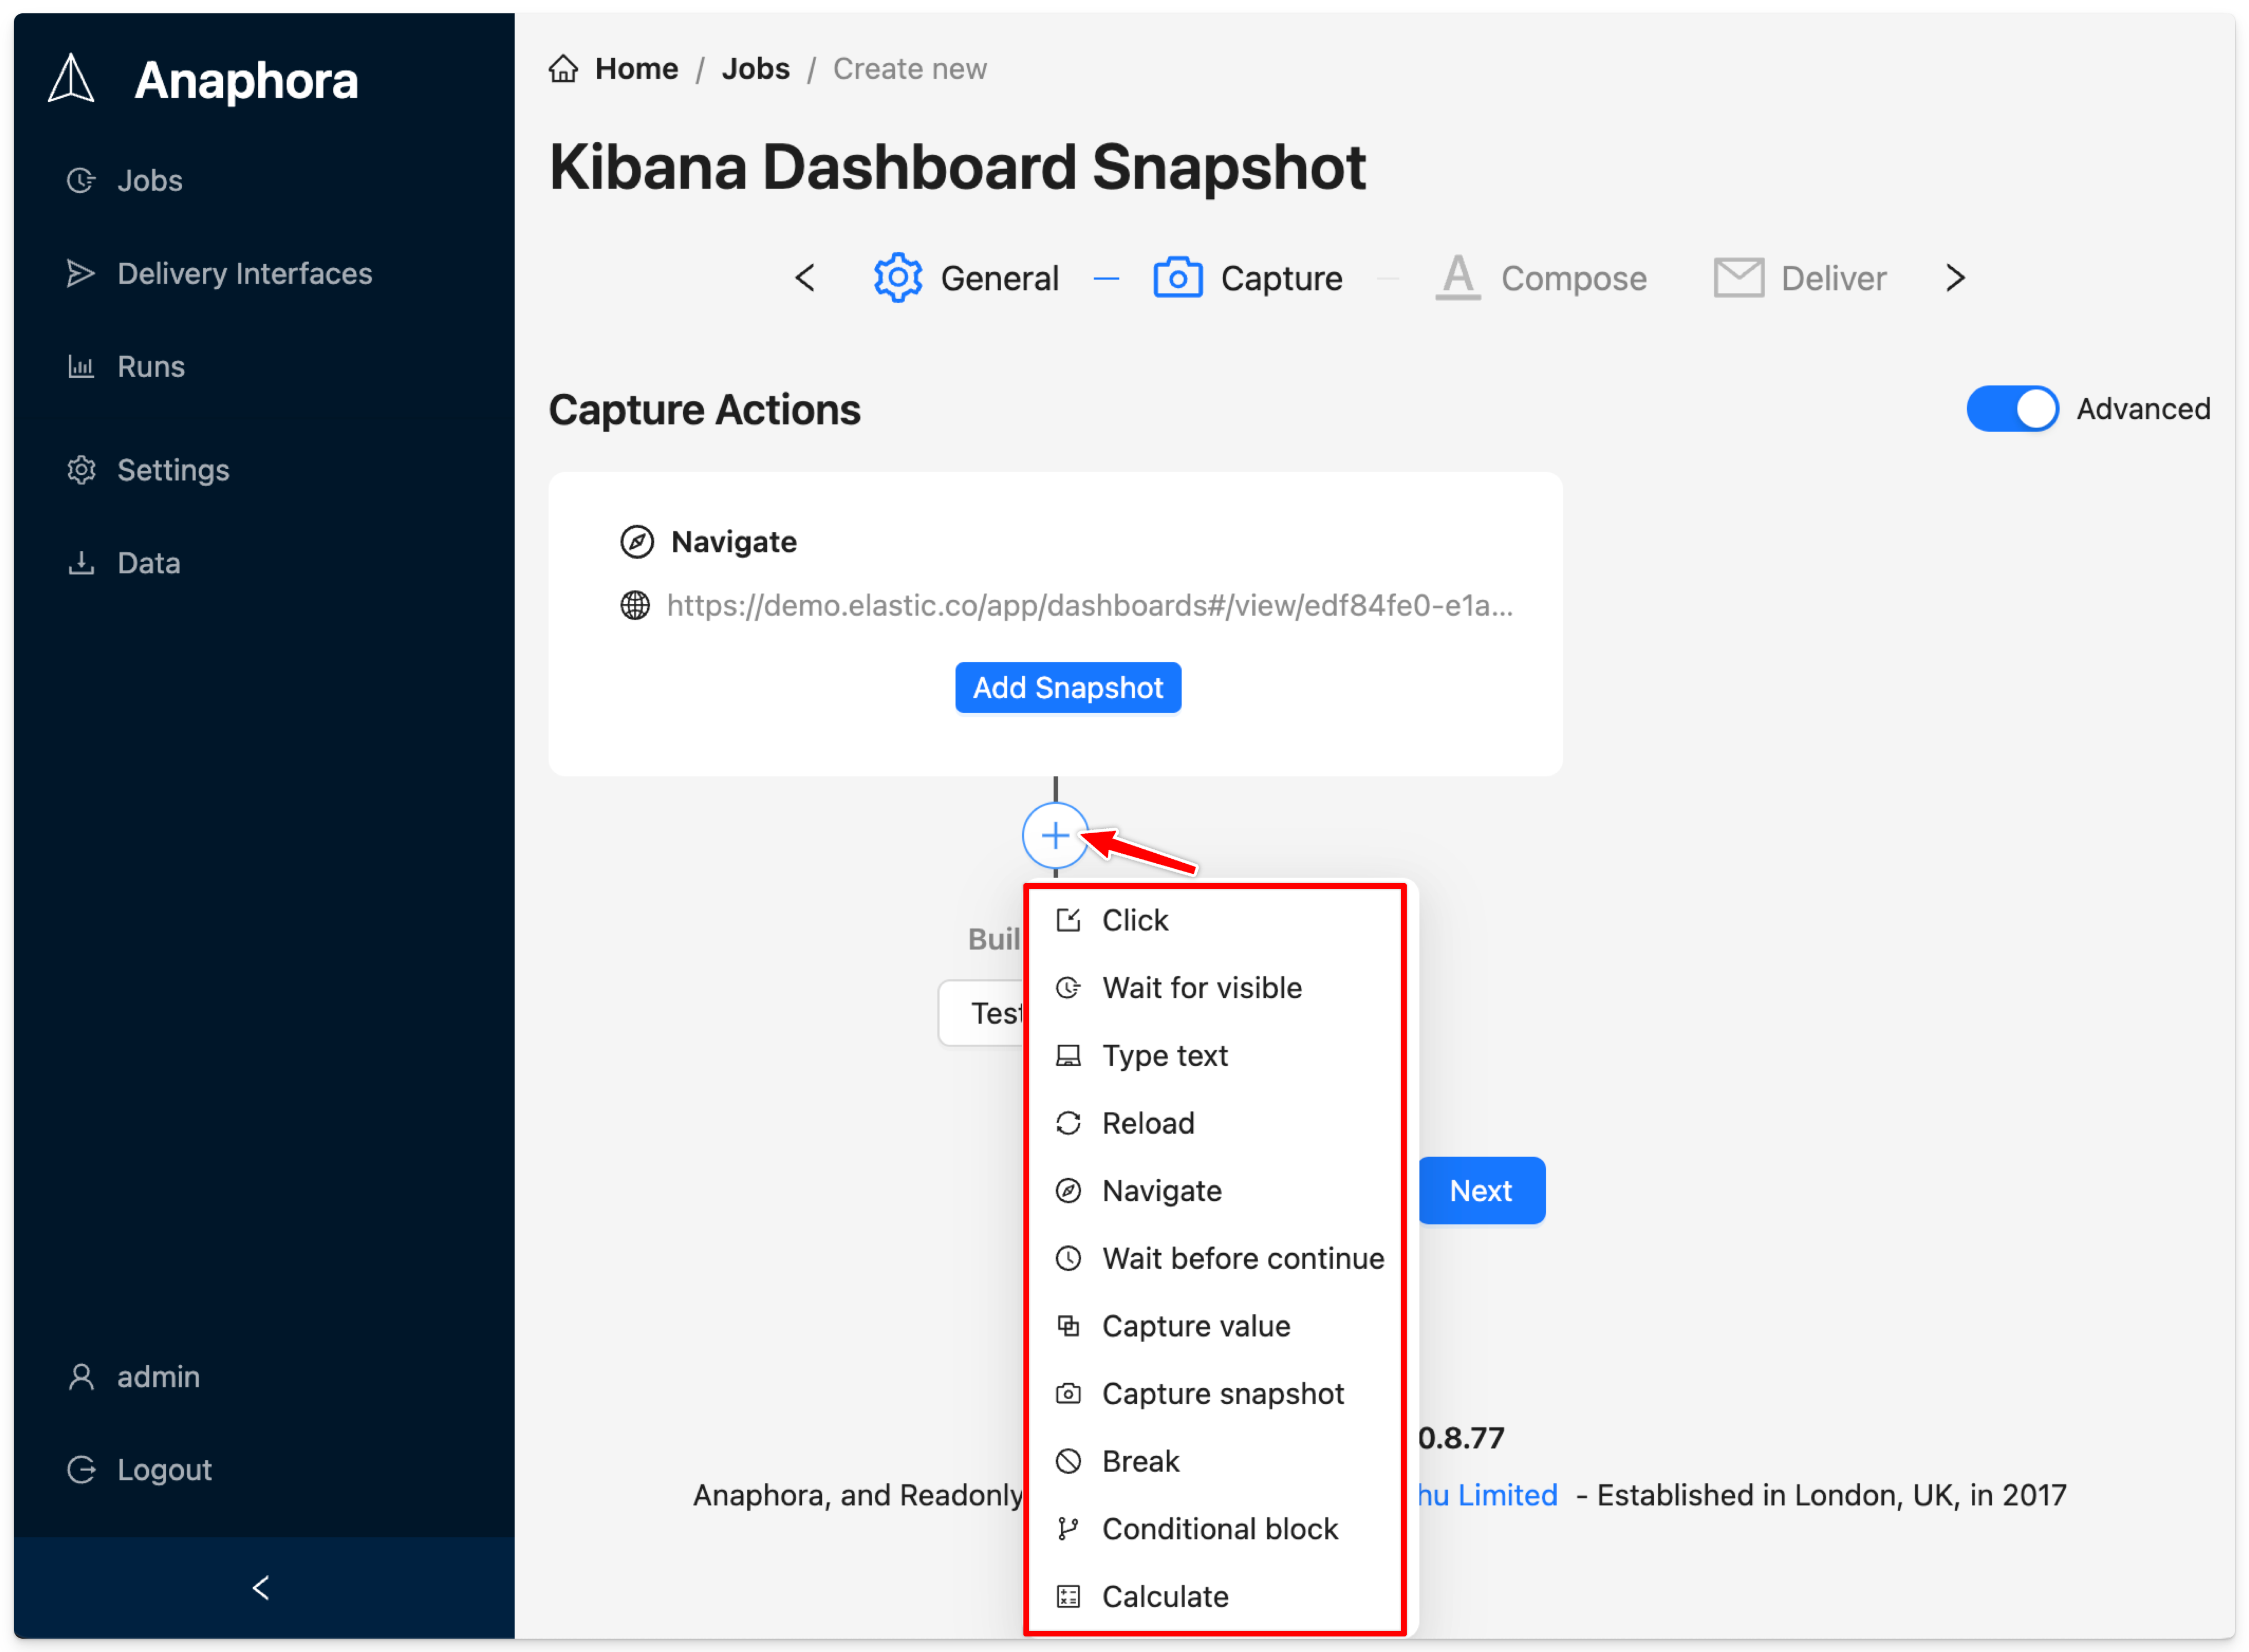
Advanced mode provides a full suite of browser automation actions for complex workflows.
Compliance & Auditing
- Automated evidence capture for compliance requirements
- Historical archive via S3 ("what did this dashboard look like on date X?")
- Audit trails with timestamps and delivery confirmations
Security Features
- Encryption at rest for internal database
- Enterprise authentication via LDAP, SAML, OpenID Connect
- Role-based access control with Space isolation
- Session management with admin visibility and forced logout
- Self-monitoring with health API for external monitoring systems
Get Started Now
Get a free trial key → — Instant activation, no credit card required.
Visit the Anaphora Forum → — Get help from the team and other users.
Next Steps
- Installation - Get Anaphora running
- Features & Editions - Compare Free, PRO, and Enterprise
- Configuration - Set up connections and preferences
- Basic Examples - Create your first report job
- Jobs - Deep dive into job configuration