Kibana Conditional Report
Check a Kibana search first, and capture and send a dashboard only when the result calls for it.
The Conditional Kibana Dashboard Snapshot template builds this flow for the public Kibana demo. Pick it under Jobs → Create Job and change the URLs and the threshold.
Goal
Every hour, count the server errors of the last 24 hours. When there are 5 or more, capture the web traffic dashboard and send it, at most once every 12 hours.
Steps
1. Create the job
- Open Jobs in the sidebar.
- Click Create Job, then Create New.
2. General
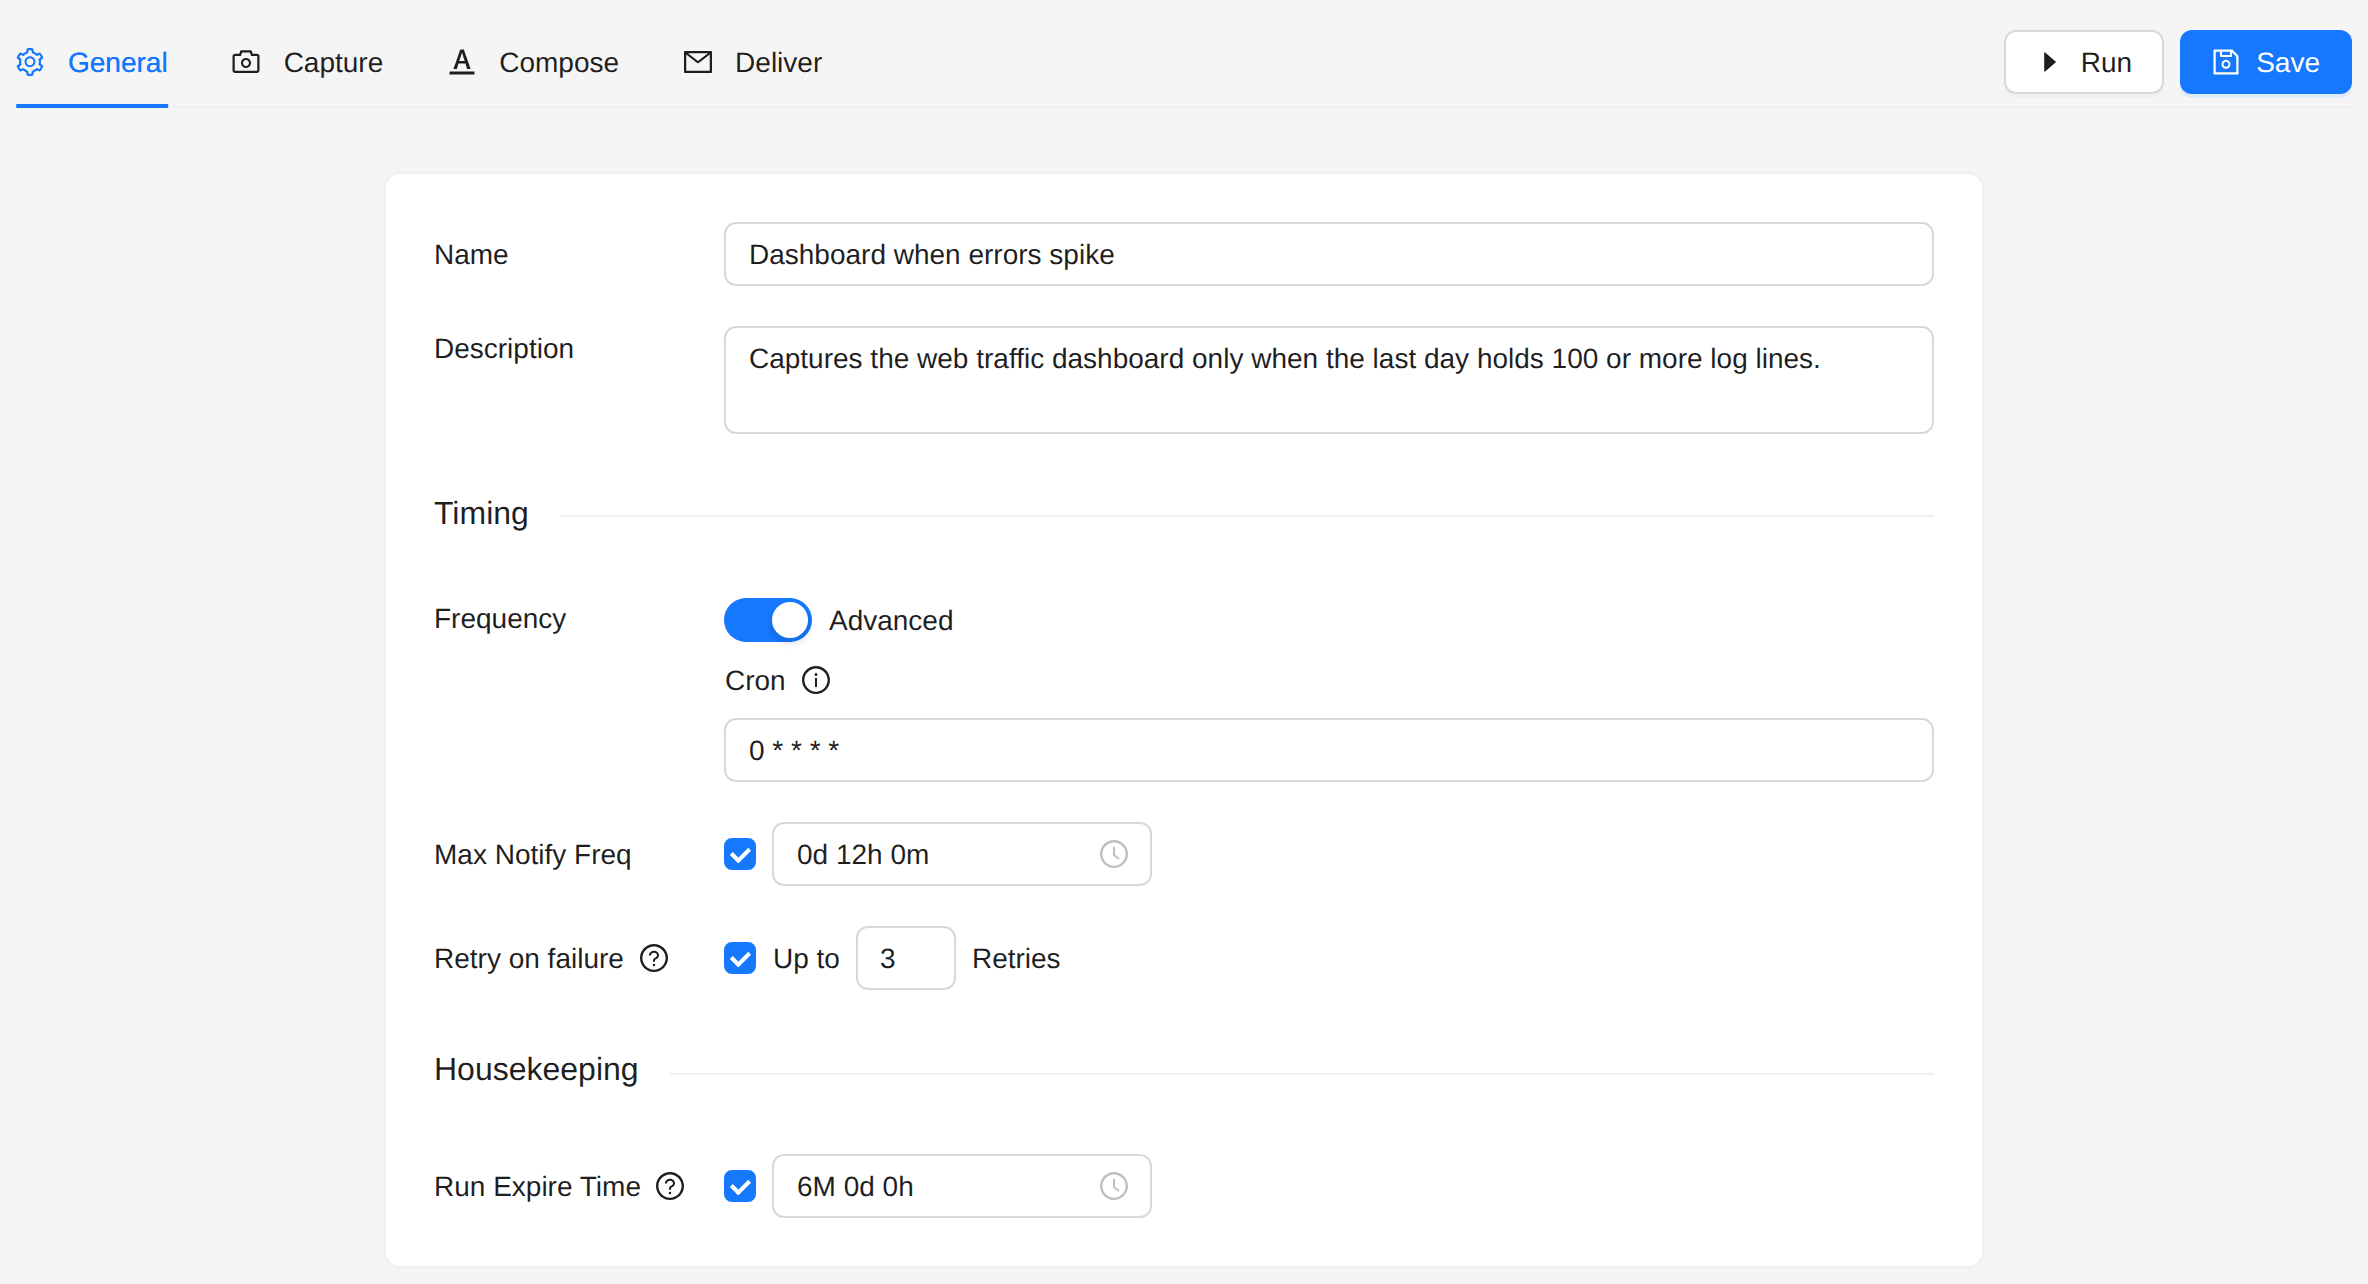
- Frequency: every hour (Advanced:
0 * * * *). - Max Notify Freq: 12 hours.
3. Capture
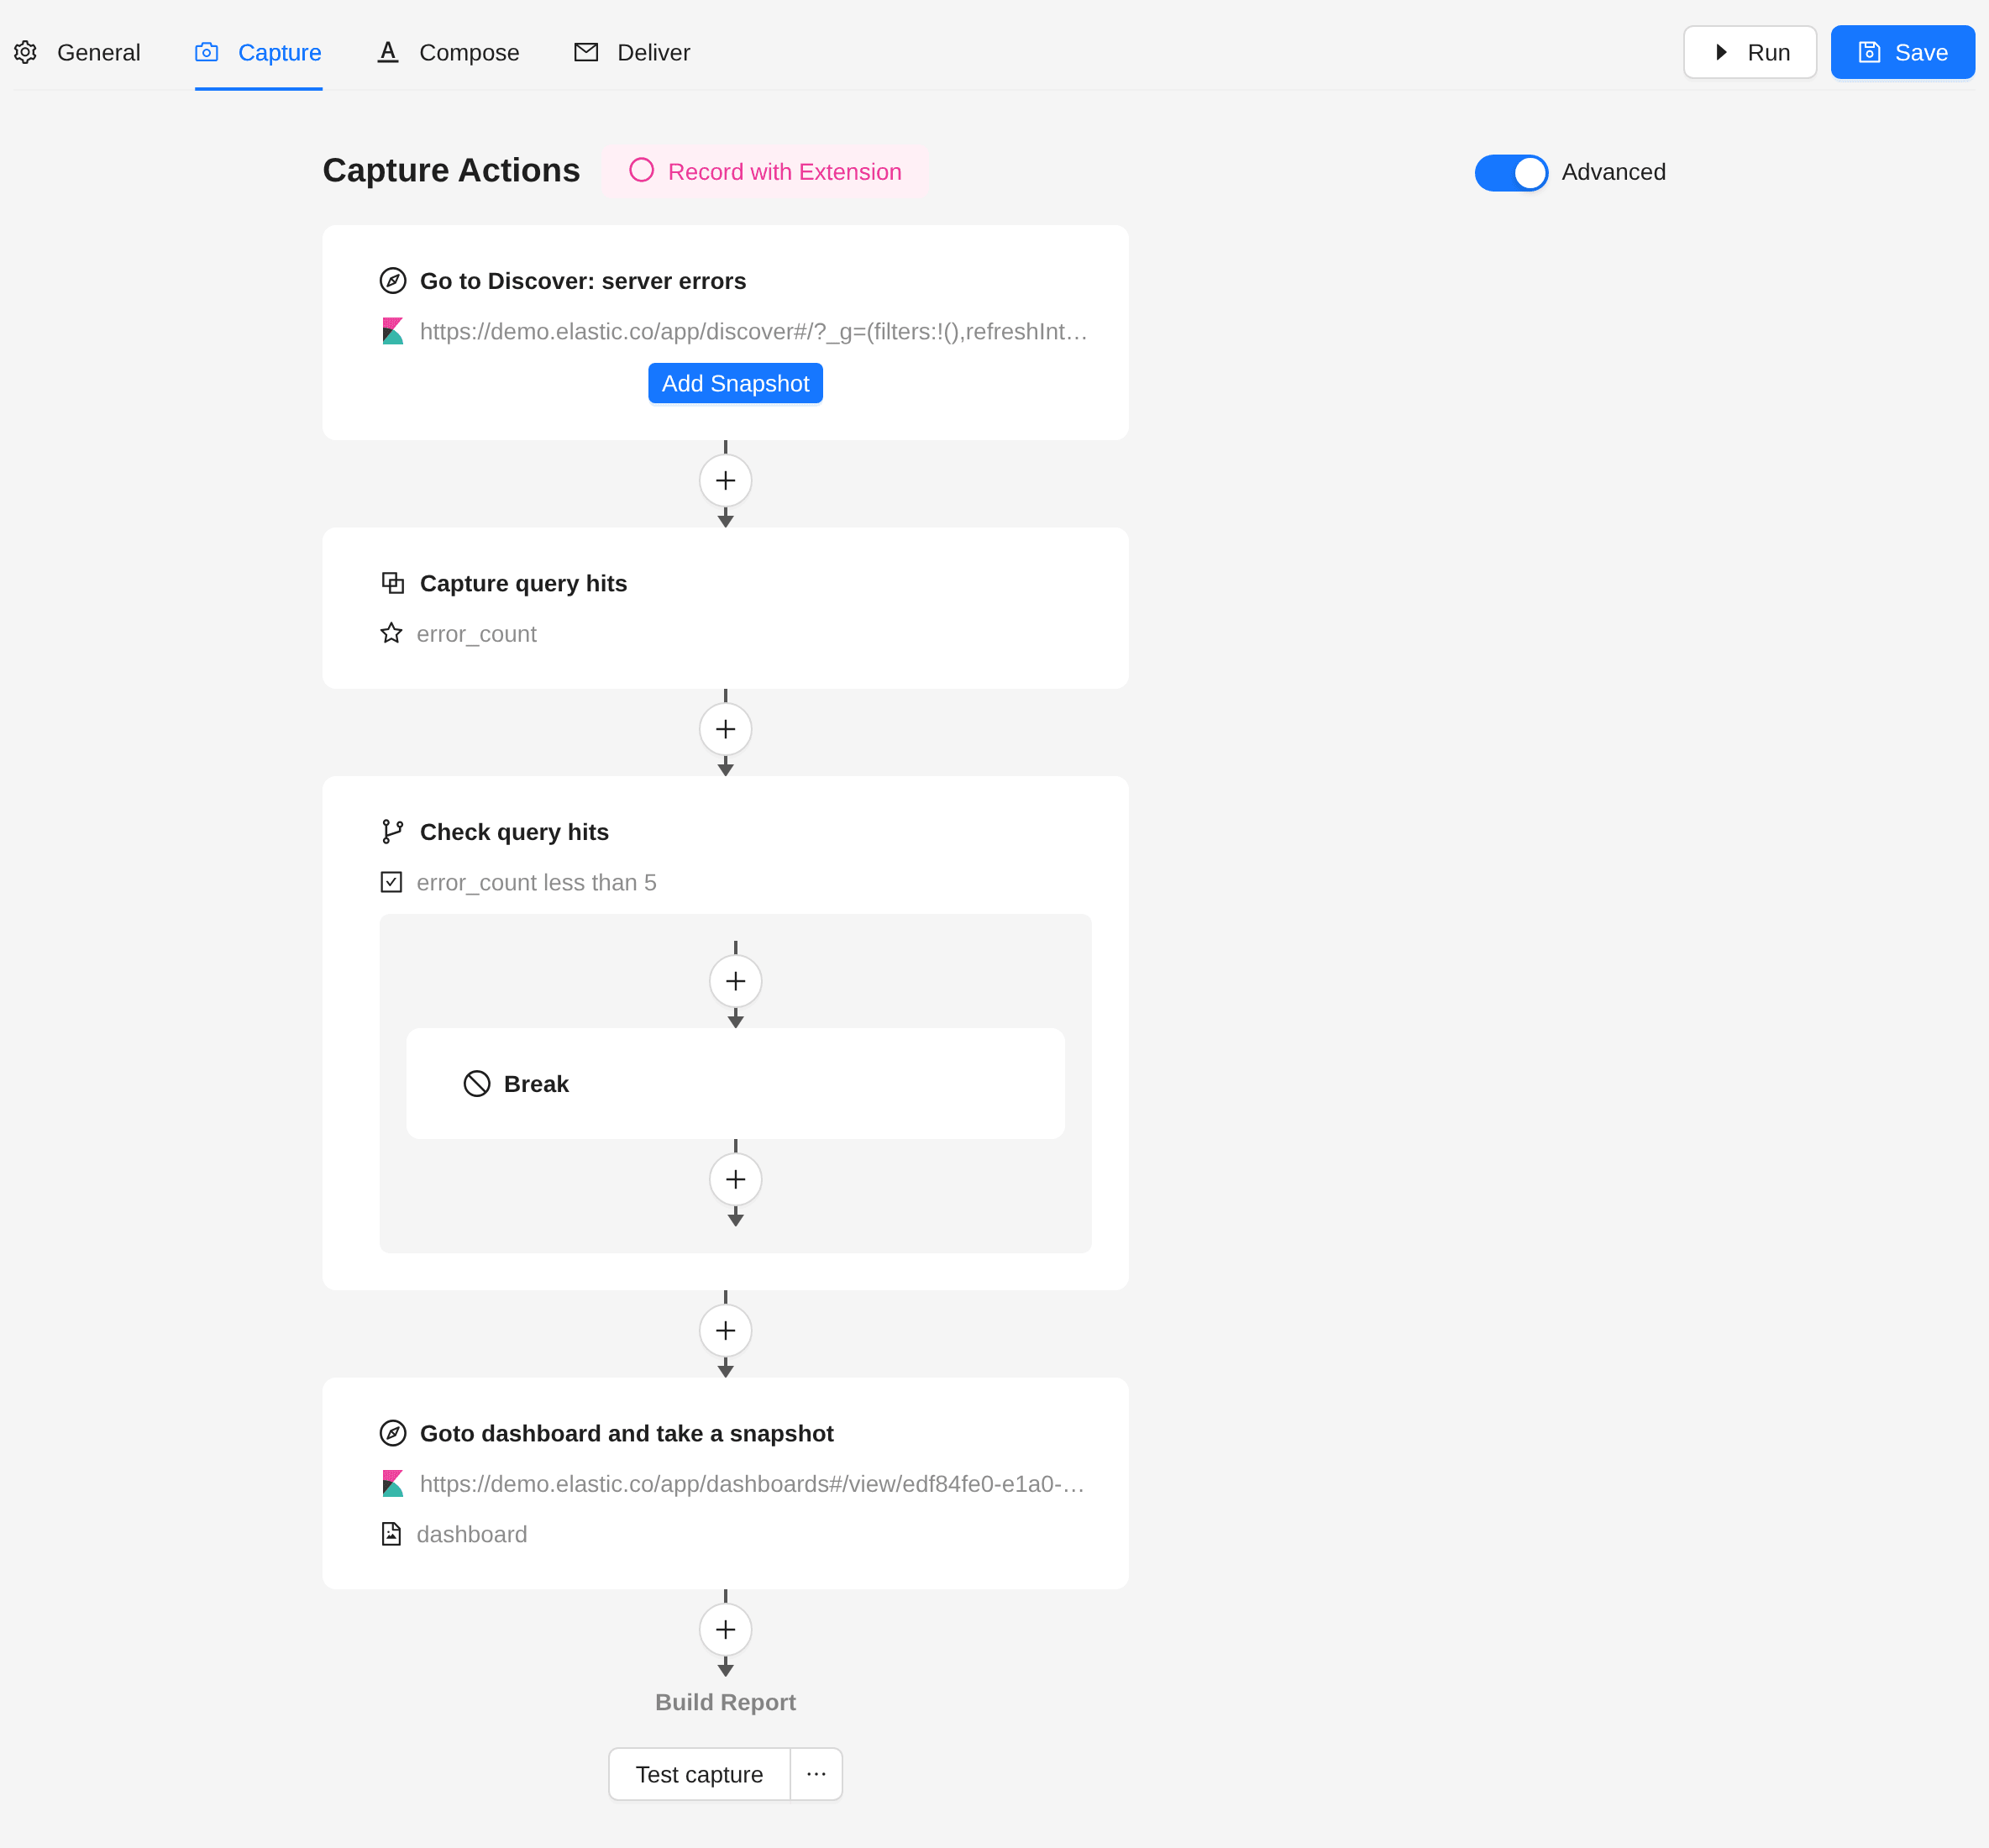
Switch on Advanced. The capture becomes a flow of actions, run from top to bottom. Click an action to edit it, and the + between two actions to add one.
-
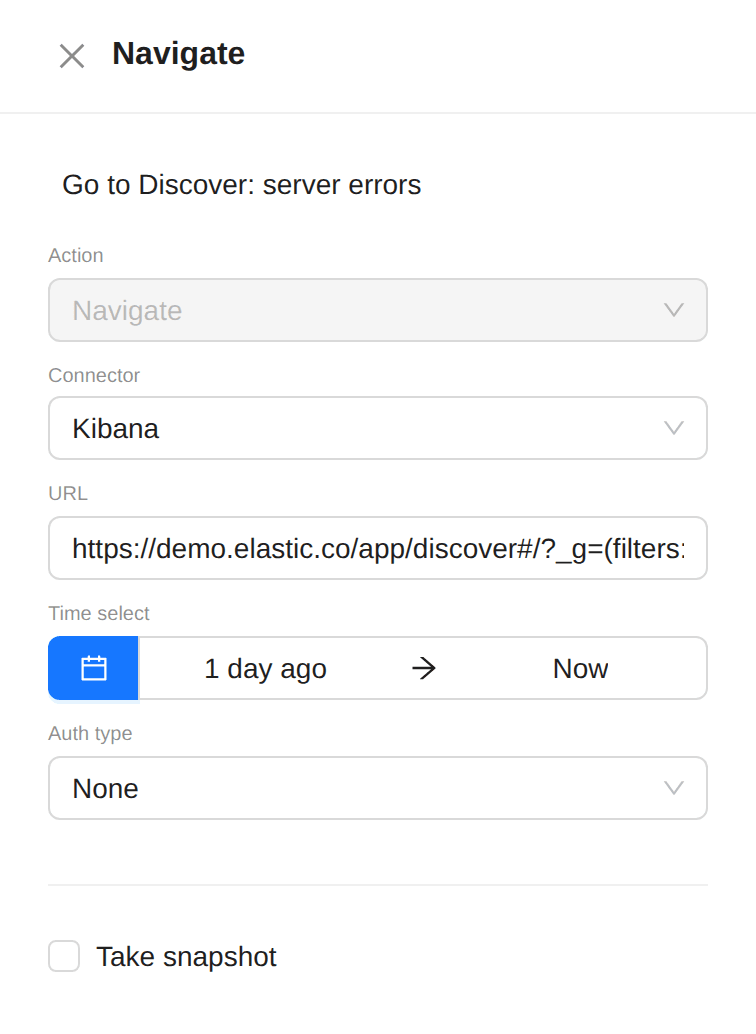
Navigate (the first action): the Discover search to check.
- Connector: Kibana.
- URL: the search, for example
response >= 500on your web logs. - Auth type: the method your Kibana needs, for example ReadonlyREST.
-
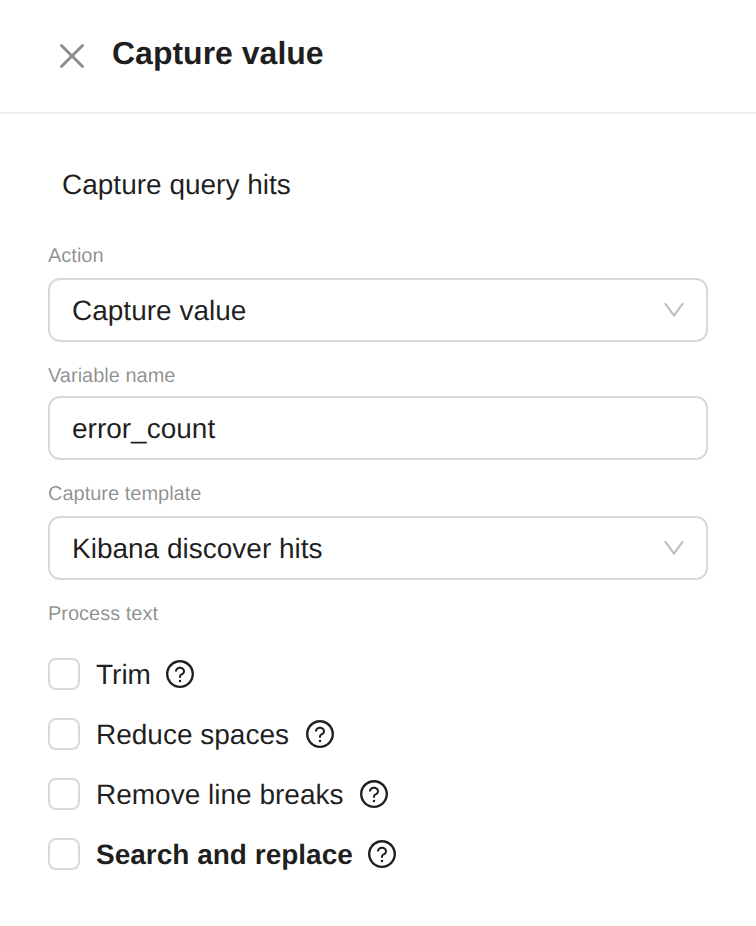
Capture value: reads the hit count into a variable.
- Variable name:
error_count. - Capture template: Kibana discover hits. It reads the count as a whole number.
- Variable name:
-
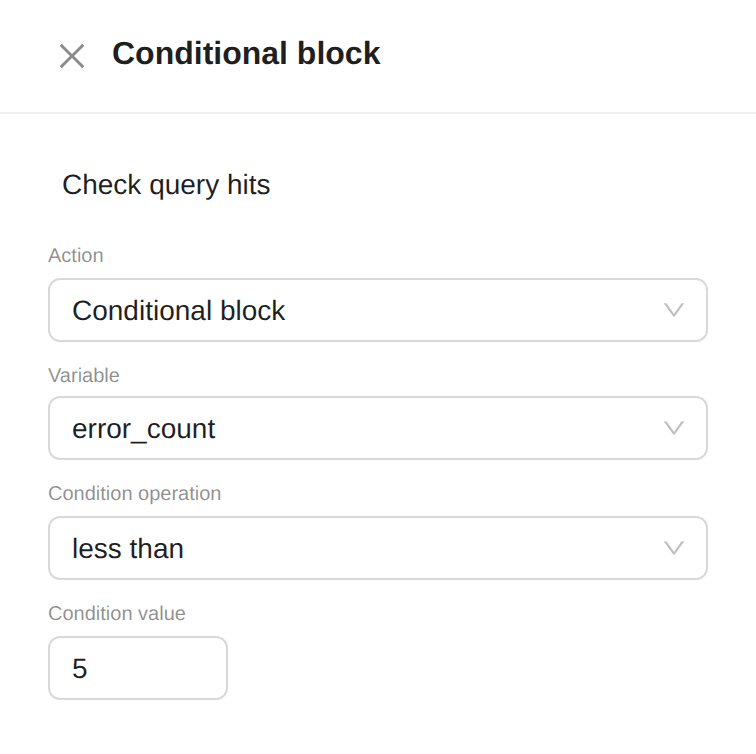
Conditional block: stops the flow when there is nothing to report.
- Variable:
error_count. - Condition operation: less than.
- Condition value:
5. - Inside the block, add a Break action. When the count is below 5, the run stops here and sends nothing.
- Variable:
-
Navigate again, below the block: the dashboard to capture. Choose Kibana, enter the dashboard URL, and tick Take snapshot.
4. Compose
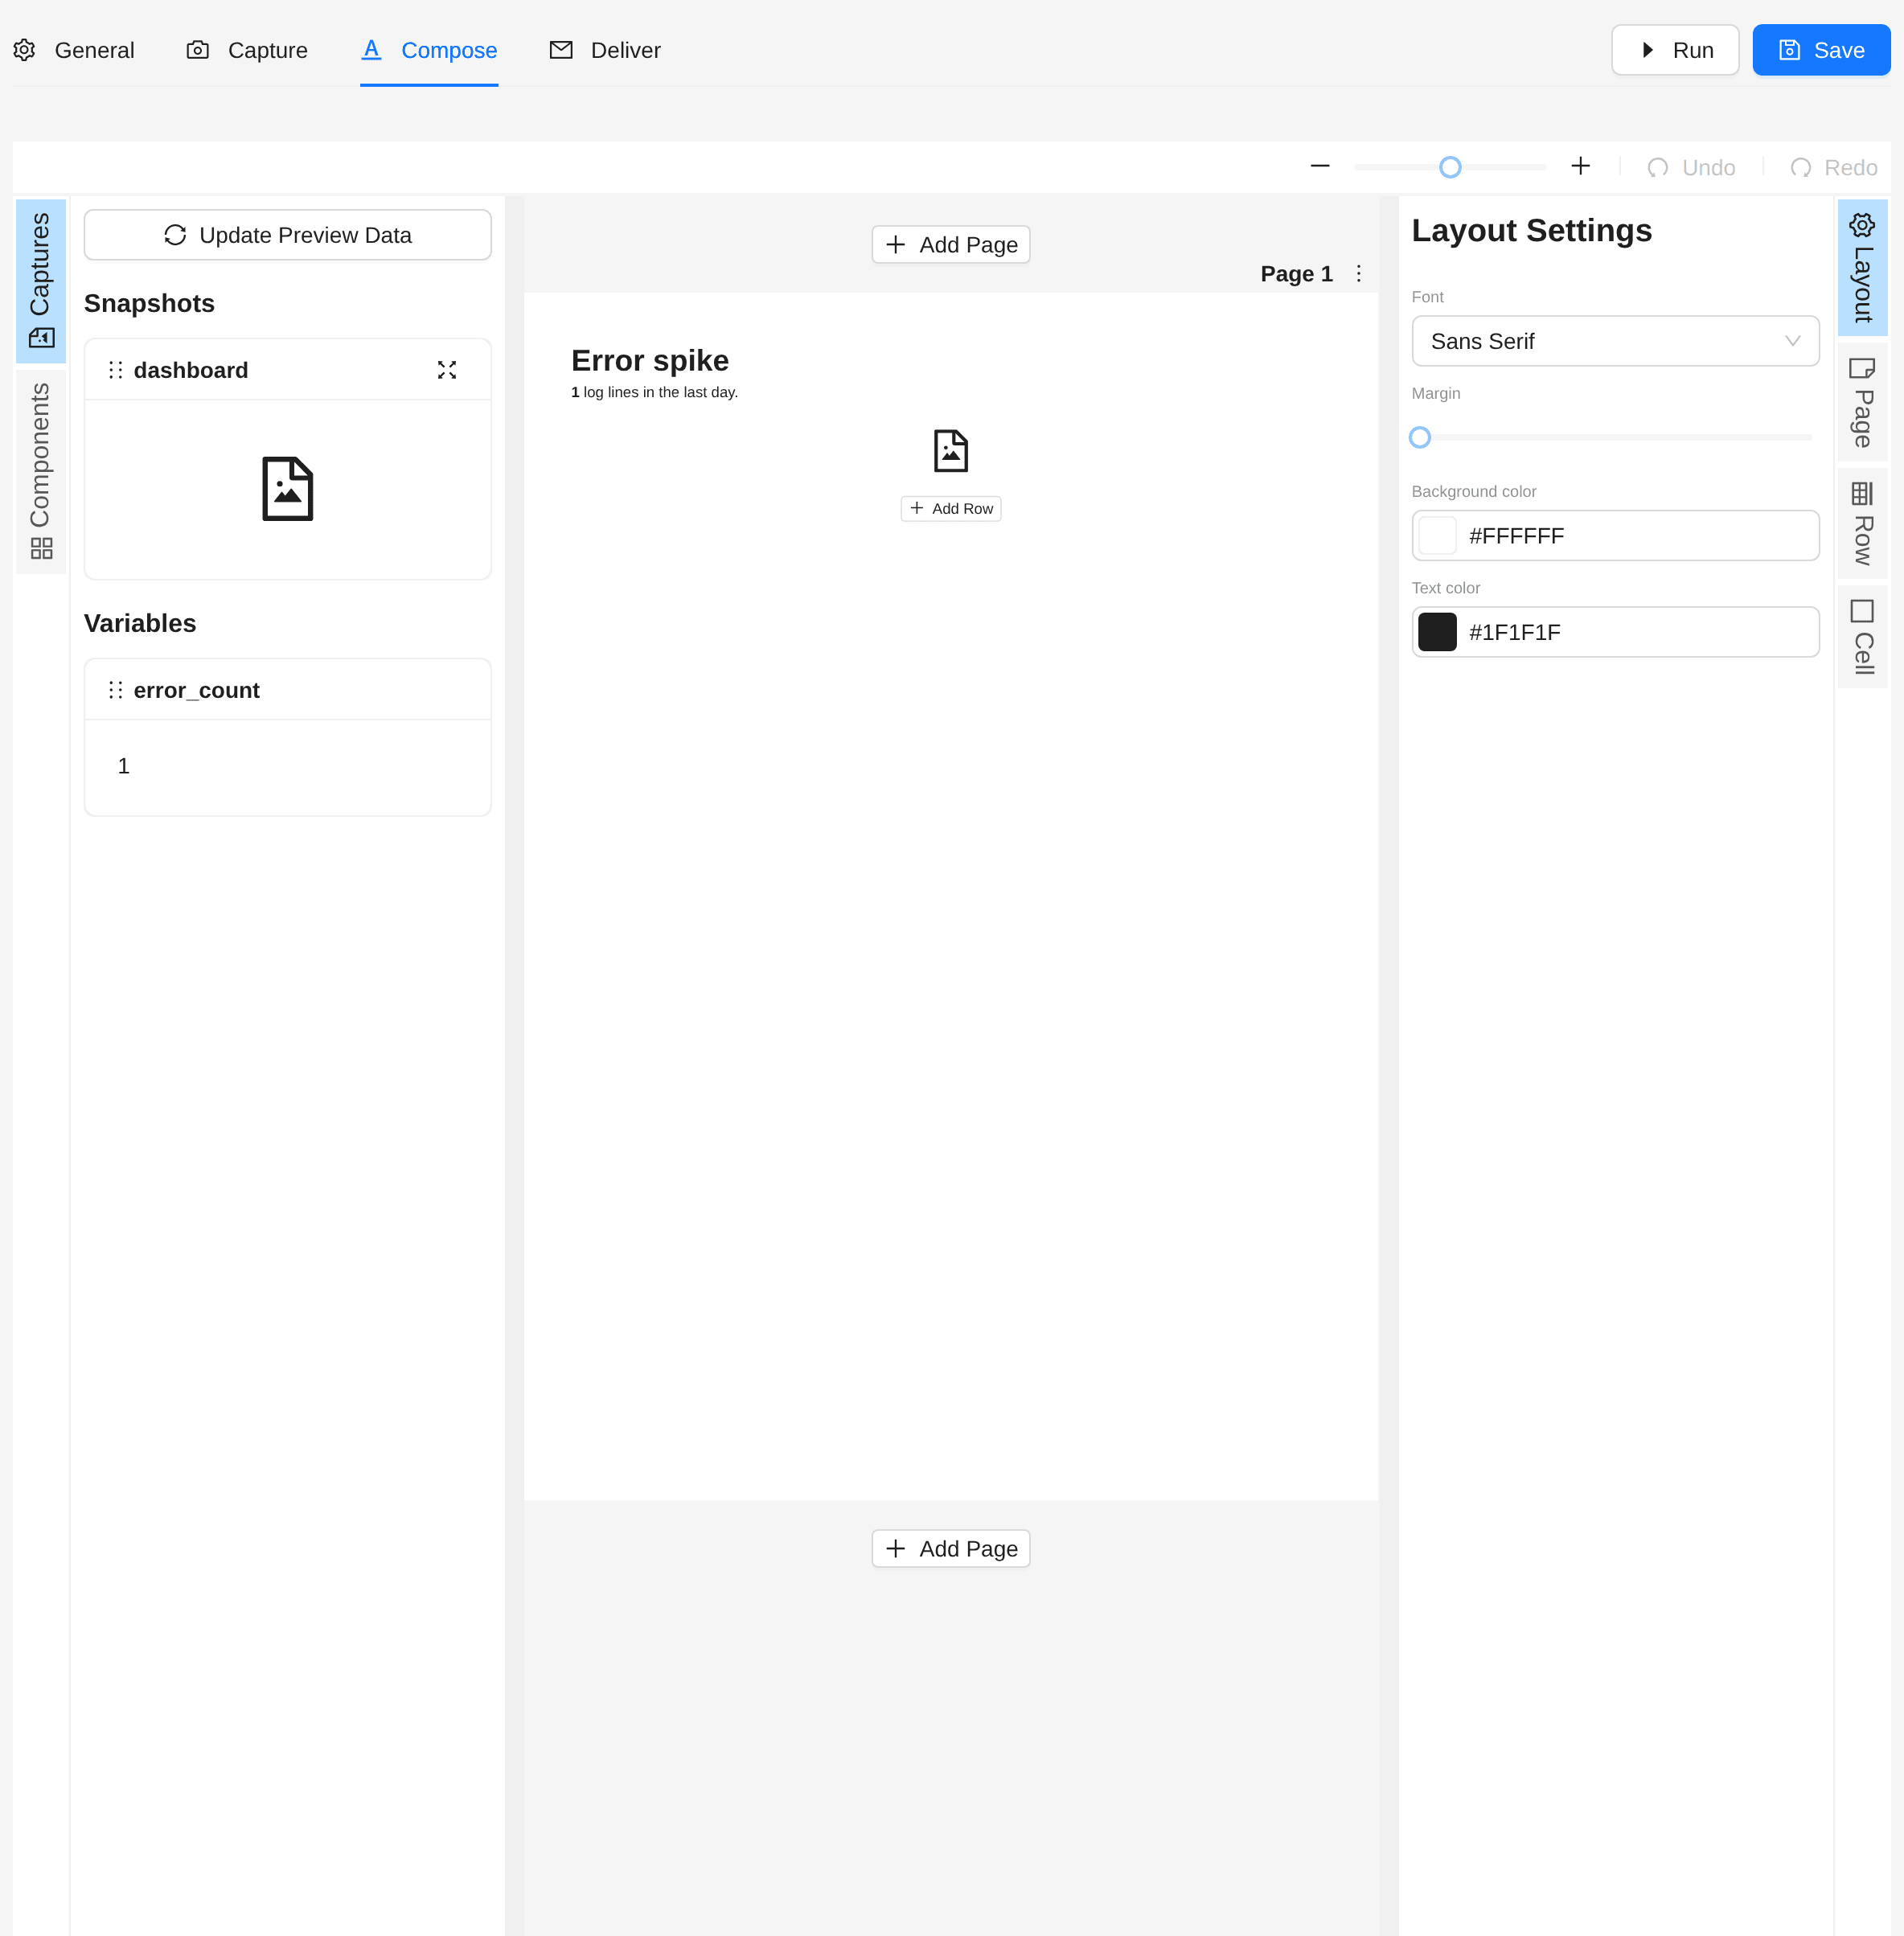
Add the dashboard snapshot, and a text block with the count:
<h1>Server errors: {{ error_count }}</h1>
<p>The web traffic dashboard at the time of the alert.</p>
5. Deliver
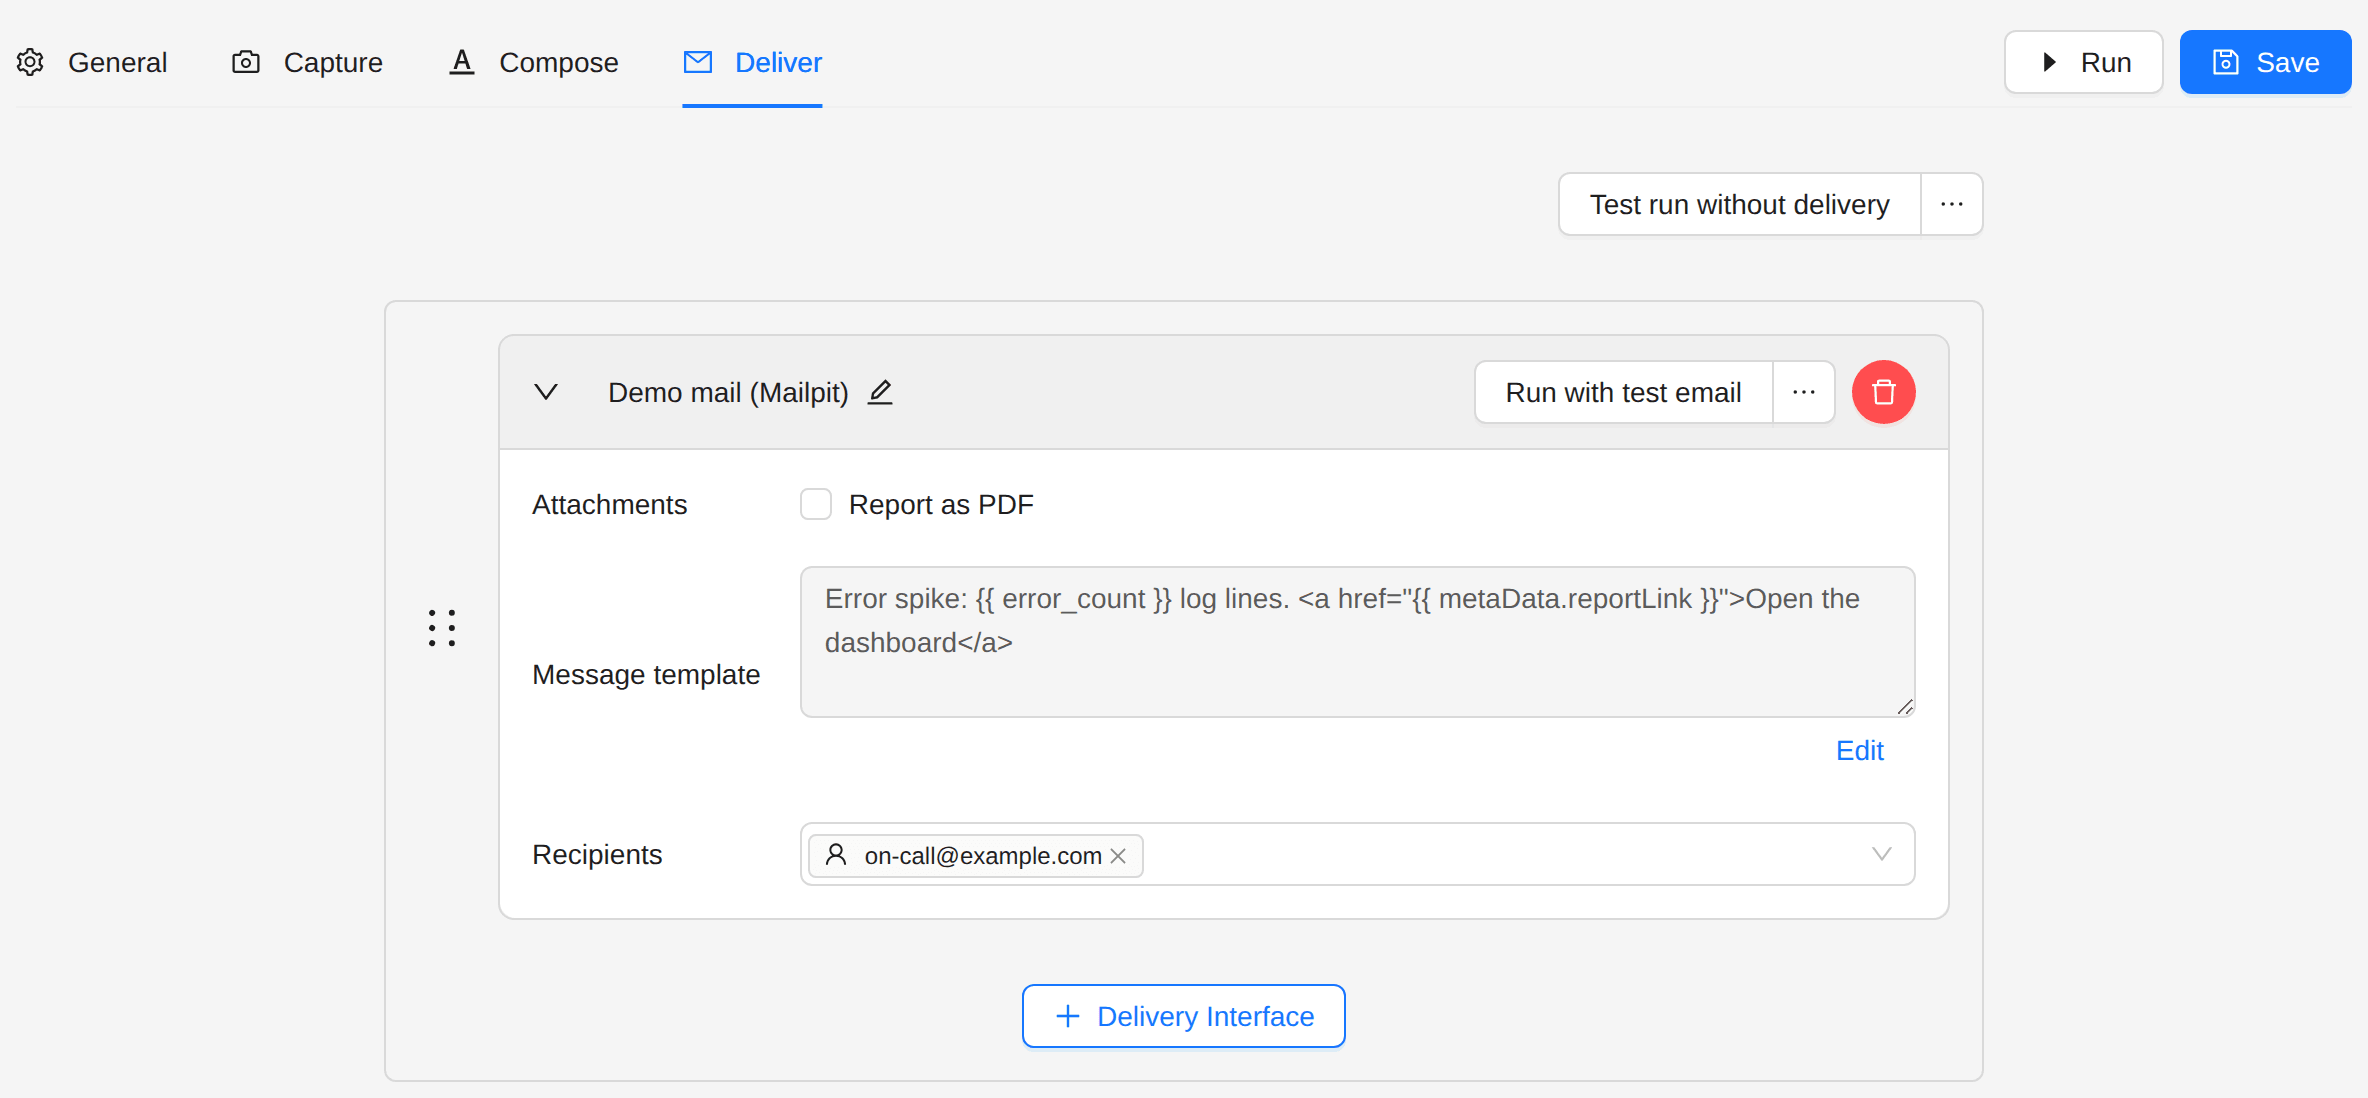
Choose a delivery interface and the recipients.
Result
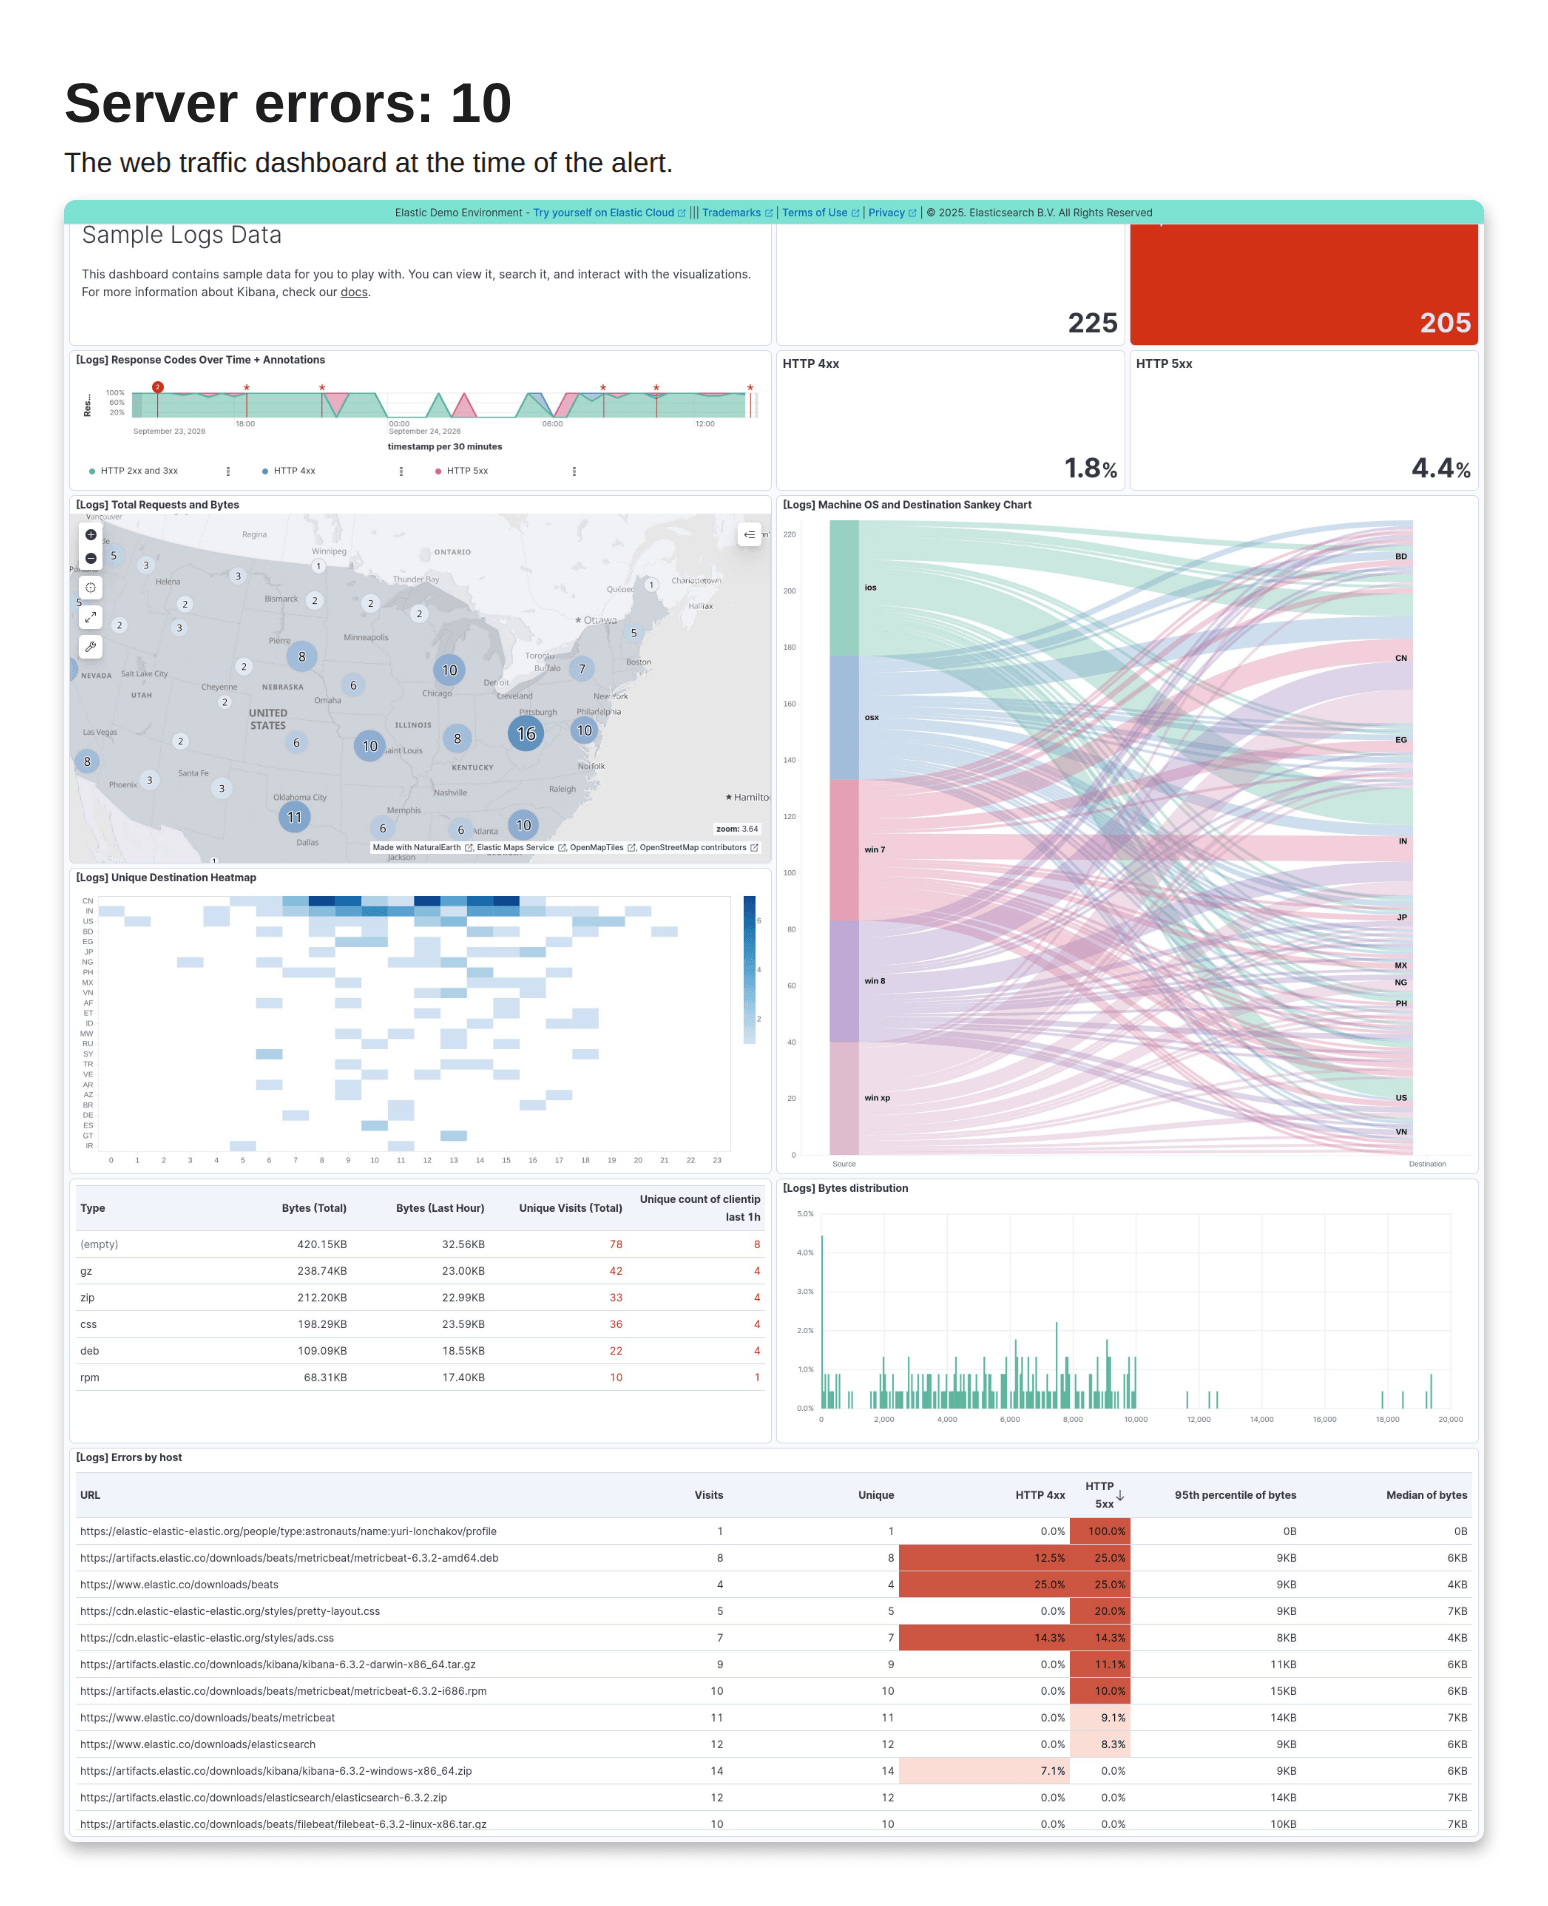
When there are 5 errors or more, the report holds the count and the dashboard:
Next steps
- Grafana Dashboard Report: add Grafana to your reports.
- Kibana Anomaly Alert: compare the current data with an earlier period.